

Django Insights
Questions about your Django app, answered as numbers and charts.
Write each insight as a small function next to your code, collect them, and get a dashboard and a SQLite file.
Documentation · Getting started · Recipes · Metrics · Theming · Upgrading from 0.2 · PyPI

[!IMPORTANT] Upgrading from 0.2? Version 0.3 is a big update: Django 5.2+ and Python 3.11+, a new dashboard, renamed settings and a database migration. Follow the upgrade checklist.
Features
Create insights for your app, store them in a SQLite database for further processing, these insights are written right next to your application logic.
Note:
Still working on some small things, extending tests and improving the documentation.
For now focus is on:
- Django 5.2 (LTS), 6.0 and 6.1;
- Python 3.11 – 3.14
Installation
Installing with:
pip install 'django-insights'
Usage
First create a insights.py file in your app directory, for example:
project
└── testapp
    └── insights.py
Each app can have it's own insights.py file, these files are auto-discovered by Django Insights, so at any given location it would pick up your metrics.
In these insights files you write out any metric you would like to track. Each metric starts with a question and some values to store. Below is a example of the @metrics.counter function:
# project/testapp/insights.py
from django_insights.metrics import metrics
from project.testapp.models import Message

label = "Workspace"


@metrics.counter(question="How many messages have been sent?")
def count_messages() -> int:
    return Message.objects.count()
Insight apps can have a label, this is used in the dashboard or can be read from insights_app table later on.
Configure Django
Add django_insights package, insights database and router to your settings
INSTALLED_APPS = [
    ...
    "django_insights",
]


DATABASES = {
    ...
    "insights": {
            "ENGINE": "django.db.backends.sqlite3",
            "NAME": os.path.join(BASE_DIR,"db/insights.db")
        },
    ...
}

DATABASE_ROUTERS = ['django_insights.database.Router']
Note: please make sure you exclude the database in your .gitignore file
Migrate insights database:
python manage.py migrate insights --database=insights
Now collect your insights
python manage.py collect_insights
You now have a database containing all insights from your application.
Note: You need to run the python manage.py collect_insights command each time you want to update data on your dashboard. In production, you can setup a cron job to call this command at regular intervals depending on your use case.
You can inspect this database yourself with sqlite3 db/insights.db - or - you can use the Django Insights dashboard.
Dashboard
To enable this dashboard, add the following settings:
from django.urls import include, path

urlpatterns = [
    path(
        'insights/',
        include('django_insights.urls', namespace='insights'),
    ),
]
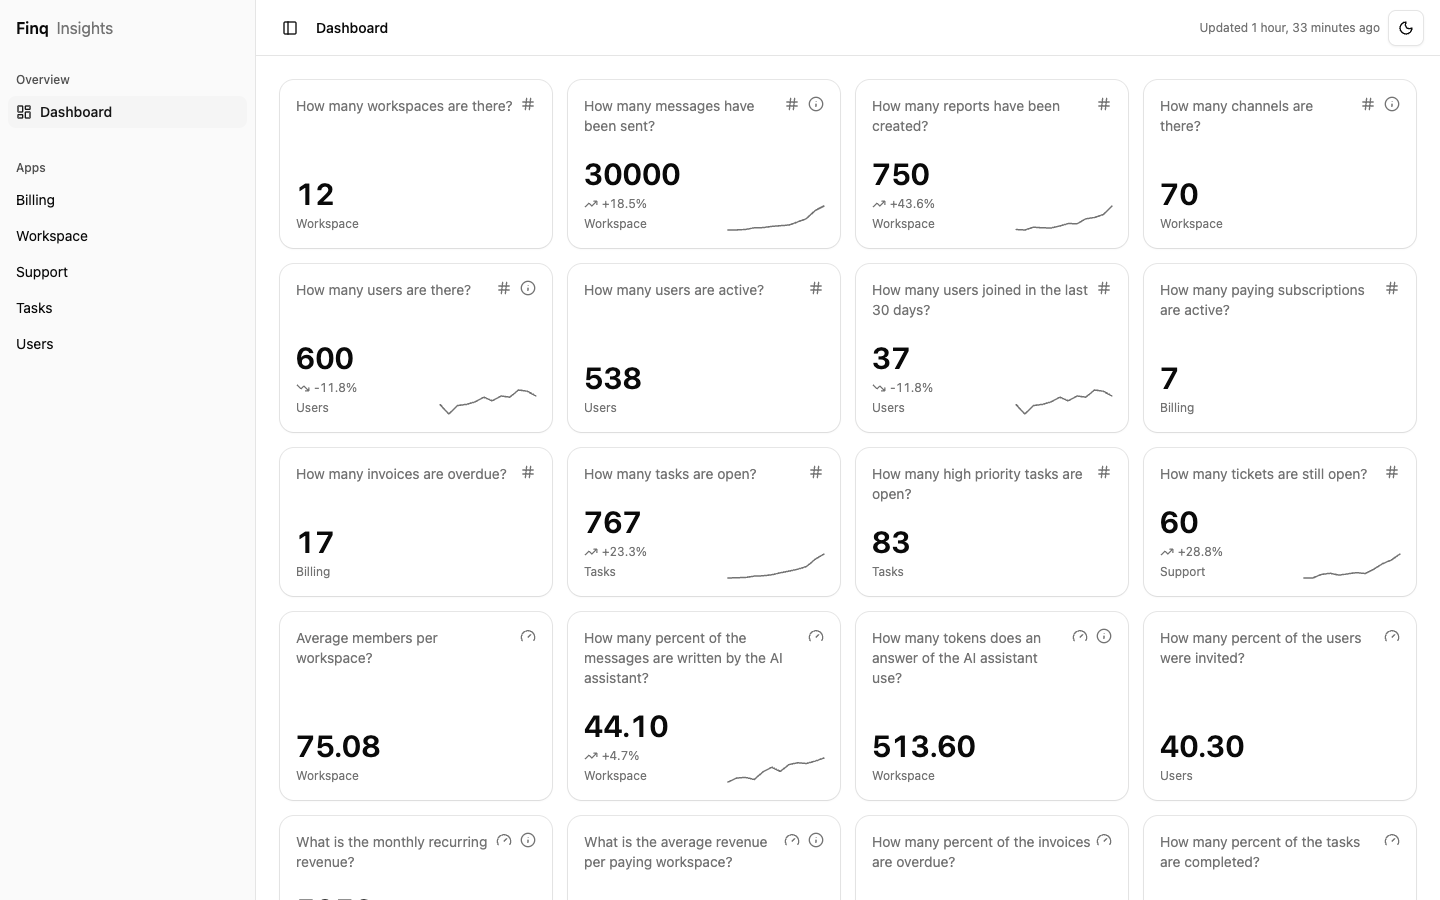
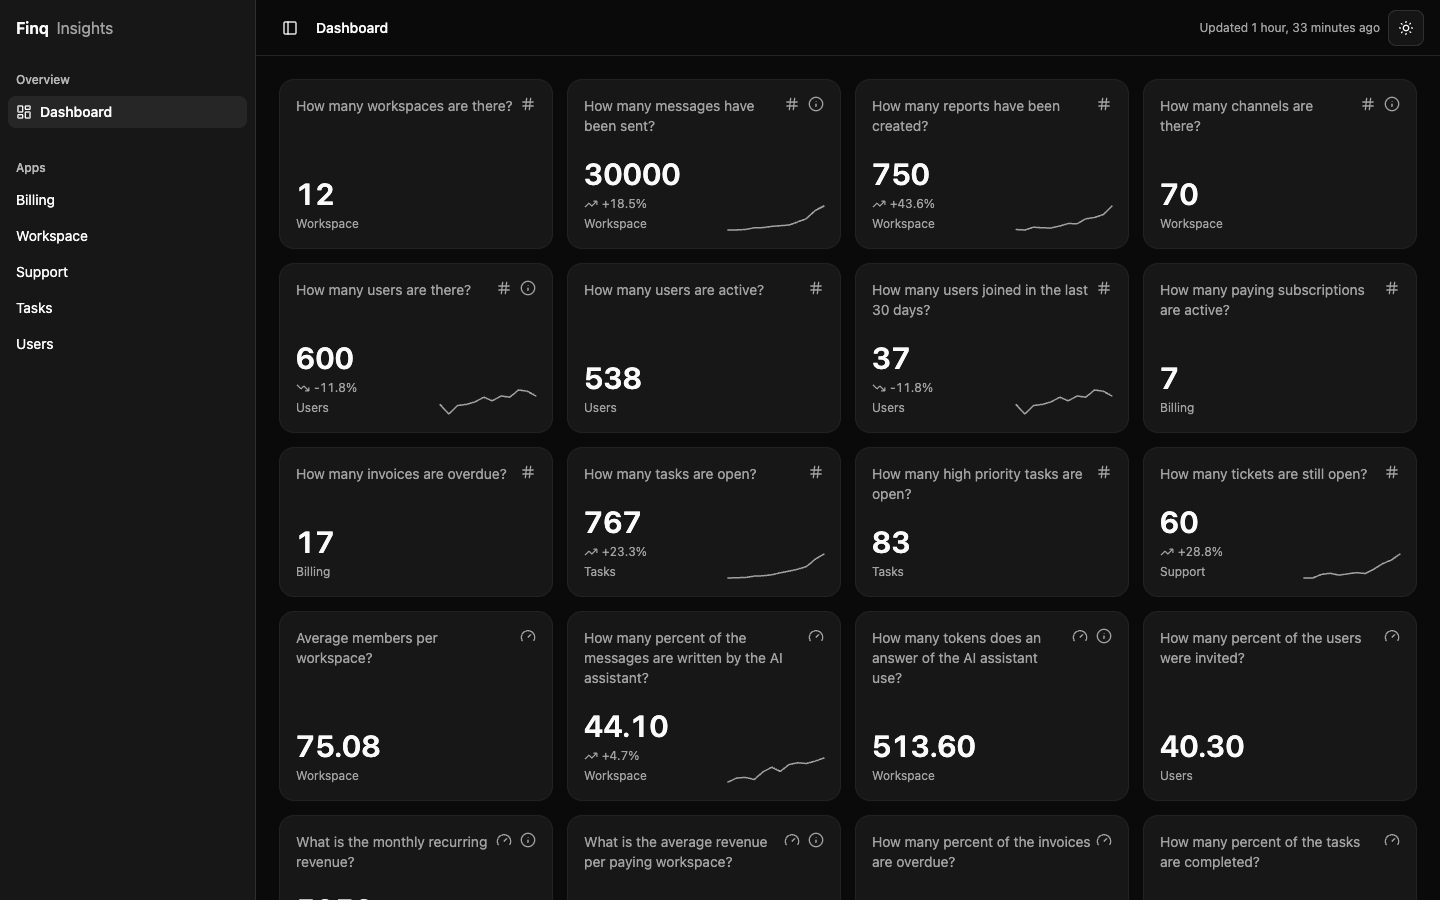
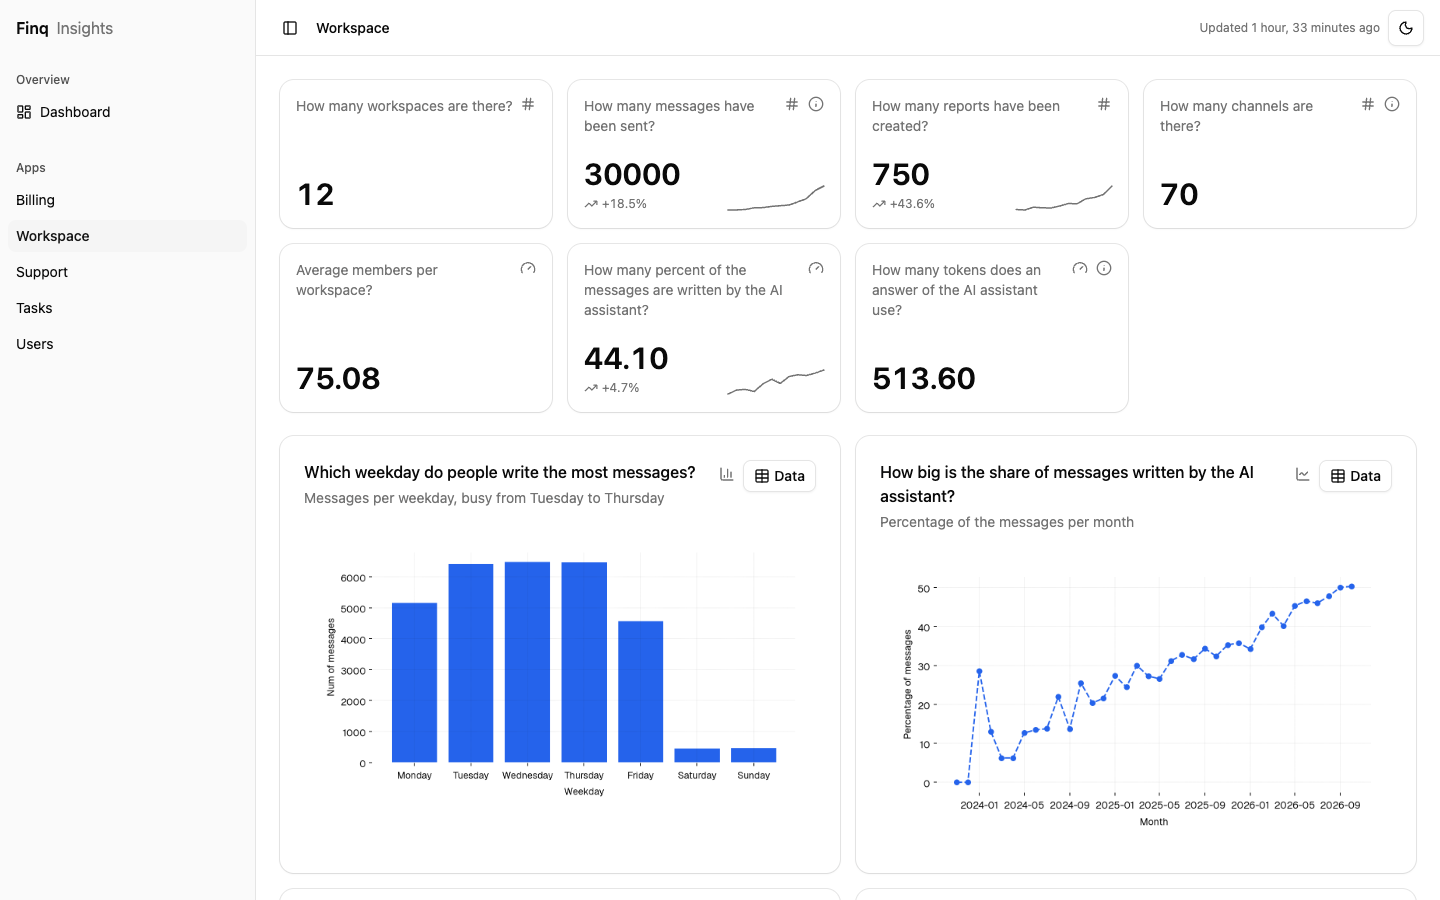
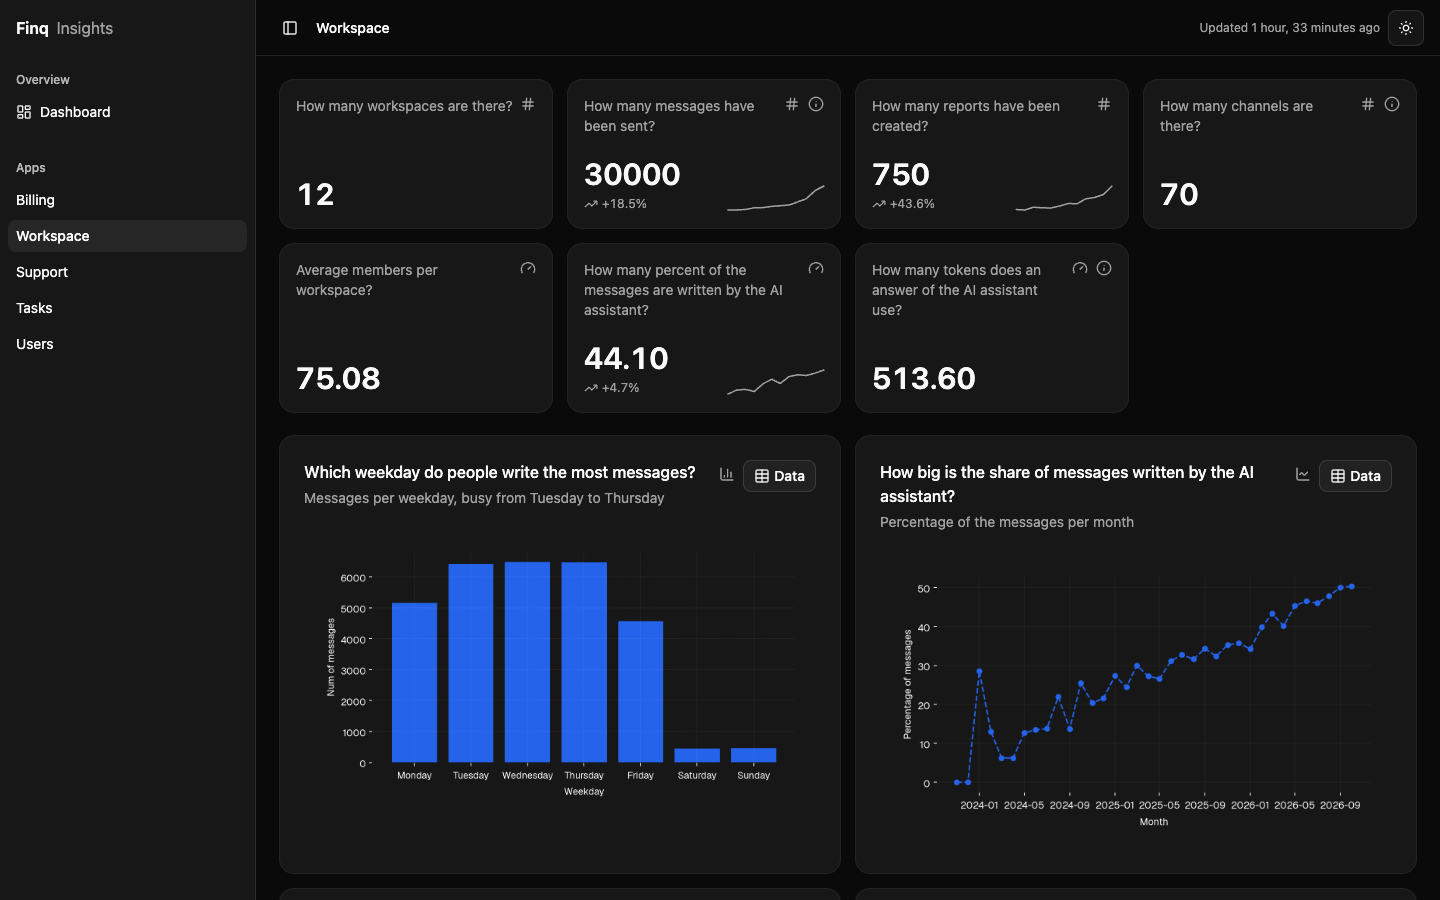
Now you can visit http://localhost:8000/insights/ to inspect your Django Insights database.
| Light | Dark |
|---|---|
 |
 |
 |
 |
Metrics
Django Insights collects six types of metrics, each one is a decorator for a function in an insights.py file:
@metrics.counter: a whole number,-> int@metrics.gauge: a decimal number,-> float@metrics.timeseries: values over time, shown as a line chart@metrics.scatterplot: pairs of values, shown as a scatter plot@metrics.barchart: values per category, shown as a bar chart@metrics.hbarchart: values per category, shown as a horizontal bar chart
Every decorator takes a question and optionally a desc. The chart types also take xlabel, ylabel, xformat, yformat and title. The functions run your own queries, a QuerySet can be returned as is.
Counter:
from django_insights.metrics import metrics
from project.testapp.models import Message


@metrics.counter(question="How many messages have been sent?")
def count_messages() -> int:
    return Message.objects.count()
Gauge:
from django.db.models import Avg, Count

from django_insights.metrics import metrics
from project.testapp.models import Workspace


@metrics.gauge(question="Average members per workspace?")
def avg_members_per_workspace() -> float:
    average = Workspace.objects.annotate(total=Count('memberships')).aggregate(
        Avg('total')
    )
    return average['total__avg'] or 0.0
Timeseries:
from django.db.models import Sum
from django.db.models.functions import TruncMonth

from django_insights.metrics import metrics
from django_insights.metrics_types import TimeSeriesResult
from project.testapp.models import Message


@metrics.timeseries(
    question="What does the AI assistant cost per month?",
    xlabel="Month",
    xformat='%Y-%m',
    ylabel="Cost in USD",
)
def ai_cost_per_month() -> TimeSeriesResult:
    return (
        Message.objects.filter(is_ai=True)
        .annotate(month=TruncMonth('created_at'))
        .values('month')
        .annotate(total=Sum('cost'))
        .values_list('month', 'total')
        .order_by('month')
    )
Scatterplot:
from django_insights.metrics import metrics
from django_insights.metrics_types import ScatterPlotResult
from project.testapp.models import Message


@metrics.scatterplot(
    question="What does a message of the AI assistant cost for its length?",
    xlabel="Tokens",
    ylabel="Cost in USD",
)
def ai_cost_vs_tokens() -> ScatterPlotResult:
    return (
        Message.objects.filter(is_ai=True)
        .order_by('-created_at', '-pk')[:500]
        .values_list('cost', 'tokens', 'model')
    )
Barchart:
from django.db.models import Count, F

from django_insights.metrics import metrics
from django_insights.metrics_types import BarChartResult
from project.testapp.models import Report


@metrics.barchart(
    question="How are the reports doing?",
    xlabel="Status",
    ylabel="Num of reports",
)
def reports_by_status() -> BarChartResult:
    return (
        Report.objects.values('status')
        .annotate(total=Count('pk'))
        .annotate(reports=F('total'))
        .values_list('total', 'reports', 'status')
    )
Horizontal barchart:
from django.db.models import Count, F

from django_insights.metrics import metrics
from django_insights.metrics_types import BarChartResult
from project.testapp.models import Channel


@metrics.hbarchart(
    question="Which channels are the busiest?",
    xlabel="Channel",
    ylabel="Num of messages",
)
def top_channels_by_messages() -> BarChartResult:
    return (
        Channel.objects.annotate(total=Count('messages'))
        .annotate(share=F('total'))
        .order_by('-total', 'name')[:10]
        .values_list('total', 'share', 'name')
    )
Trend
A counter or gauge can show a trend: a small line and the change of the last point against the one before it. Give it a trend function that returns a time series, the same rows a timeseries insight returns:
from django.db.models import Count
from django.db.models.functions import TruncMonth


def signups_per_month():
    return (
        AppUser.objects.annotate(month=TruncMonth('date_joined'))
        .values('month')
        .annotate(total=Count('pk'))
        .values_list('month', 'total')
        .order_by('month')
    )


@metrics.counter(question="How many users are there?", trend=signups_per_month)
def count_users() -> int:
    return AppUser.objects.count()
The trend is read from your own data on every collect and stored with the counter, so it is rebuilt together with everything else and nothing needs a backup. The latest 60 points are kept. The trend describes what its query returns, not the value itself: the example shows the signups per month next to the total number of users. Leave out the running month, it is not complete yet and shows as a drop.
What to return
Return an iterable of tuples, a QuerySet from values_list(...) works. The position of each value matters:
| Type | Row | Notes |
|---|---|---|
timeseries |
(timestamp, value) |
timestamp is a datetime, xformat formats the timestamp in the table |
scatterplot |
(vertical, horizontal, category) |
the first value is drawn on the vertical axis |
barchart |
(height, unused, label) |
the second value is stored, but not drawn |
hbarchart |
(length, unused, label) |
the length is shown behind the bar, labels over 30 characters are cut |
A missing label (None) is shown as an empty label. Use the result types TimeSeriesResult, ScatterPlotResult and BarChartResult from django_insights.metrics_types to annotate the functions.
Collecting
python manage.py collect_insights
All insights are collected in one transaction on the insights database: either everything is replaced, or nothing is. Your own databases are only read by the queries you write in your insights.
When an insight raises an exception it is logged (logger django_insights.registry) and reported, the other insights still run. The command prints every failed insight and exits with an error, for example 1 of 14 insights failed. The progress bar is hidden when the output is not a terminal, so it is safe in cron.
Run python manage.py check after changing the settings below, it warns about a missing insights database, a missing router, an invalid permission or a renamed setting. These checks only warn, they never stop your project from starting.
Settings
All settings are optional and read from your Django settings.
| Setting | Default | Description |
|---|---|---|
INSIGHTS_APP_NAME |
"MyApp" |
Name shown in the dashboard |
INSIGHTS_DEFAULT_THEME |
"dark" |
"light" or "dark", used until a visitor chooses a theme |
INSIGHTS_CHART_DPI |
180 |
Resolution of the chart images |
INSIGHTS_STYLE |
"vega" |
Basecoat style: vega, nova, maia, lyra, mira, luma, sera or rhea |
INSIGHTS_THEME |
None |
A shadcn theme name like "blue", or a dict with your own colors, see below |
INSIGHTS_CHARTS_USE_MEDIA_CACHE |
False |
Keep rendered charts as files instead of rendering them on every request |
INSIGHTS_MEDIA_CACHE_ROOT |
None |
Directory for the cached charts, required when the cache is on. Only cached chart images in it are deleted |
INSIGHTS_DASHBOARD_PERMISSIONS |
None |
List of permission classes, see below |
The dashboard always requires a logged in user. To restrict it further, add permission classes, every class must return True:
class IsStaff:
    def has_permission(self, request):
        return request.user.is_staff


INSIGHTS_DASHBOARD_PERMISSIONS = [IsStaff]
A class without a has_permission method denies access, it never grants it.
Version 0.3 renamed INSIGHT_CHARTS_USE_MEDIA_CACHE, INSIGHT_MEDIA_CACHE_ROOT and INSIGHT_DASHBOARD_PERMISSIONS to the INSIGHTS_ prefix. The old names are ignored, manage.py check warns when they are still set.
Theming
The dashboard and the charts share one palette, so a color you set shows up in both. INSIGHTS_STYLE picks one of the Basecoat styles. INSIGHTS_THEME sets the colors, with the names of the shadcn/ui themes:
INSIGHTS_STYLE = "sera"
INSIGHTS_THEME = "blue"
- Accent colors change the primary color and the five chart colors:
amber,blue,cyan,emerald,fuchsia,green,indigo,lime,orange,pink,purple,red,rose,sky,teal,violetandyellow. - Base colors change the greys of the background, cards and borders, and give grey charts:
neutral,stone,zinc,mauve,olive,mistandtaupe.
Combine them, or set single colors, with a dict. accent takes a theme name or any hex color, light and dark set colors on top of it:
INSIGHTS_THEME = {
    "base": "zinc",
    "accent": "blue",
    "dark": {"card": "#111827", "border": "#1f2937"},
}
A color is one of the shadcn variables with underscores, for example background, foreground, card, muted_foreground, border, primary, primary_foreground, sidebar_primary or chart_1 to chart_5, all as "#rrggbb". A chart uses card as its background, foreground for its text, and chart_3 (light) or chart_1 (dark) for its bars and lines. Anything else is ignored, manage.py check tells you what.
The theme colors come from the shadcn registry. To update them run python scripts/generate_palettes.py and then ruff format django_insights/palettes.py.
Testing your insights
The pytest plugin comes with Django Insights, there is nothing to configure. It gives a test the plain function behind an insight, so you can test your queries against the test database. Nothing is saved.
import pytest
from django.utils import timezone

from project.testapp.models import Channel, Message, Workspace


@pytest.mark.insights
@pytest.mark.django_db
def test_count_messages(insights_query):
    workspace = Workspace.objects.create(name='Acme', created_at=timezone.now())
    channel = Channel.objects.create(
        workspace=workspace, name='general', created_at=timezone.now()
    )
    Message.objects.create(channel=channel, created_at=timezone.now())

    assert insights_query() == 1
The insight is found by the name of the test without test_. To choose another one, give the marker a name: @pytest.mark.insights('count_messages'). When two apps have an insight with the same name, use module.name, for example 'shop.insights.count_orders'. A name that does not exist fails the test with a message.
Use-cases
Insights are gathered from your current application state, Django Insights is not intentend to be used as a realtime, incremementing data-source. You should be able to re-gather these insights from your actual data at any moment in time.
Yes:
- How many users, how many users invited a year
- How many reports a day, how many messages send on Wednesday's
No:
- How many GET request for url XXX a second
- Realtime profit target percentage
Background
I'm currently working at a small company that is in the process of renewing some parts of our product. To gain insight into the usage over different periods, we have tried a few solutions. We initially attempted to periodically generate CSV files from queries, as well as send data to a dashboard at regular intervals.
We ended up with many exports that where spread out over multiple people. Additionally, exporting data directly from the database also posed a security risk, as it required constant movement of possible sensitive information. After several months of working with CSV files, which were often outdated and required conversion by other (paid) tools, we where looking for a better solution.
I wanted an easy-to-configure file within our various apps that would allow me to create "insights" easily, so Django Insights was born. I decided to switch to a local SQLite database which could be share on request, as a plus these files can be tracked by a security officer.
Ideas
- Connect to other datasources and export to different file-formats ( ArrowFile?, NDJSON )
Is it any good?
License
The MIT License