
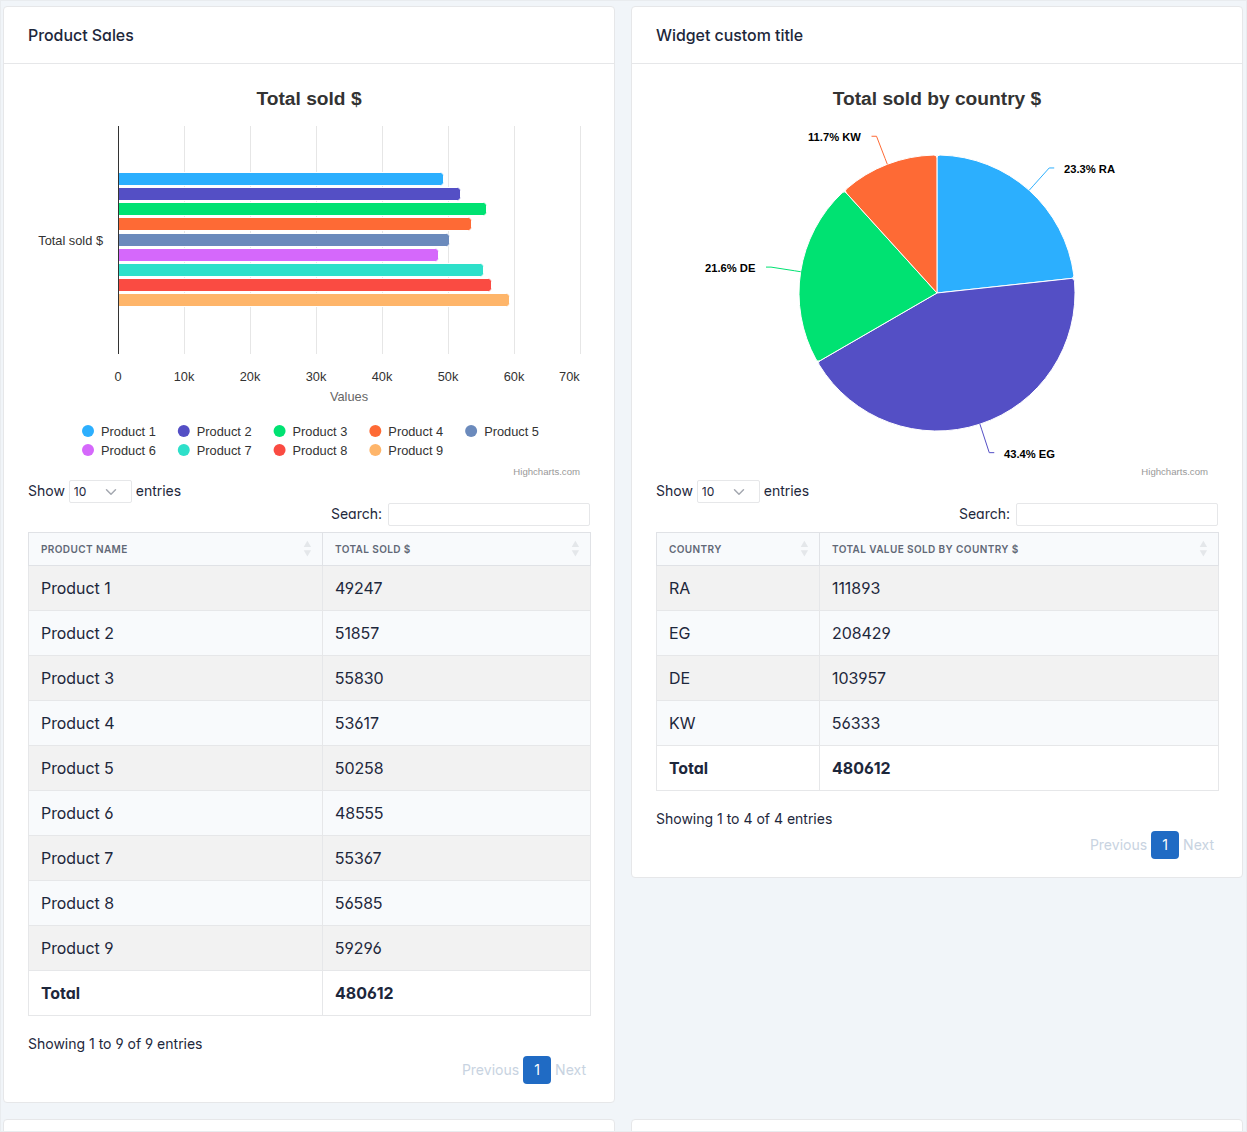
One report class, every chart
Declare the calculation once. Switch the visualization by changing a single argument — no new query, no new template.
Why Django Slick Reporting?
- Every report shape — simple aggregates, group-by, time-series, crosstab/pivot, and combinations of them.
- Charts included — Highcharts, Chart.js and ApexCharts wrappers. Bar, column, line, area, pie — stacked or totalled — from one
Chart(...)line. - Custom calculations — build reusable computation fields, chain dependencies, compute percentages and balances.
- Dashboards — drop any report onto a page as a self-contained widget with a template tag.
- Model-optional — report against a Django model, a traversed relation, a raw SQL table, or precomputed/aggregated data.
- Fast & extendable — optimized queries, CSV export out of the box, and hooks for everything.
Installation
pip install django-slick-reporting
Add it to INSTALLED_APPS and you're ready:
INSTALLED_APPS = [
    ...,
    "crispy_forms",
    "crispy_bootstrap5",
    "slick_reporting",
]
Quickstart
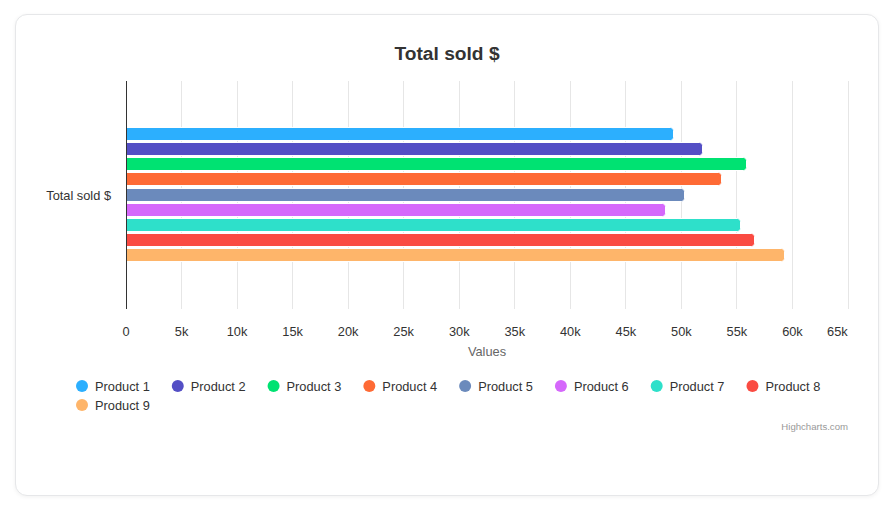
Given a typical SalesTransaction model, here is a group-by report — total value sold per product — with a bar chart:
|
|
That's the whole report — filter form, chart, sortable data table and CSV export are generated for you.
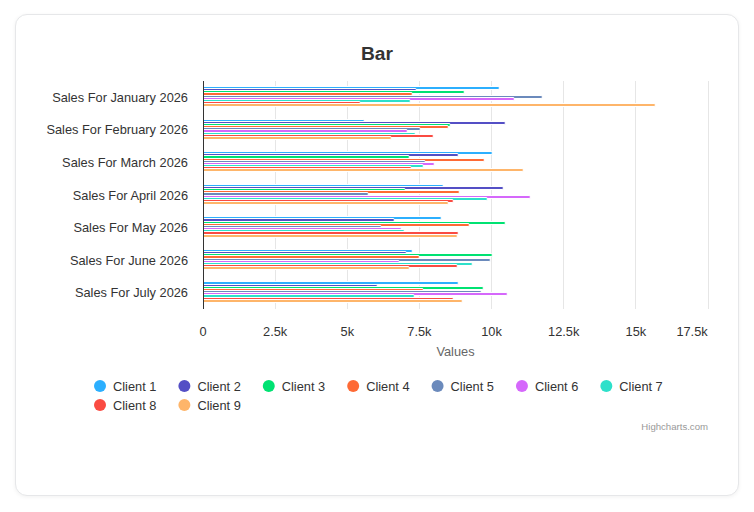
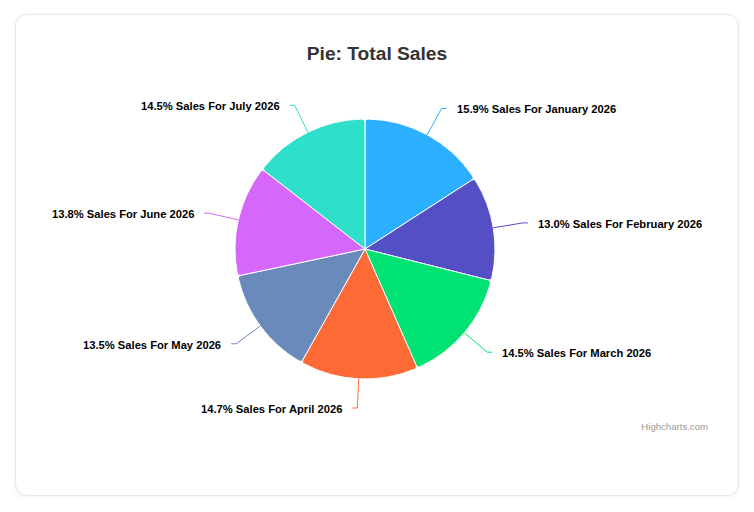
Same data, any visualization
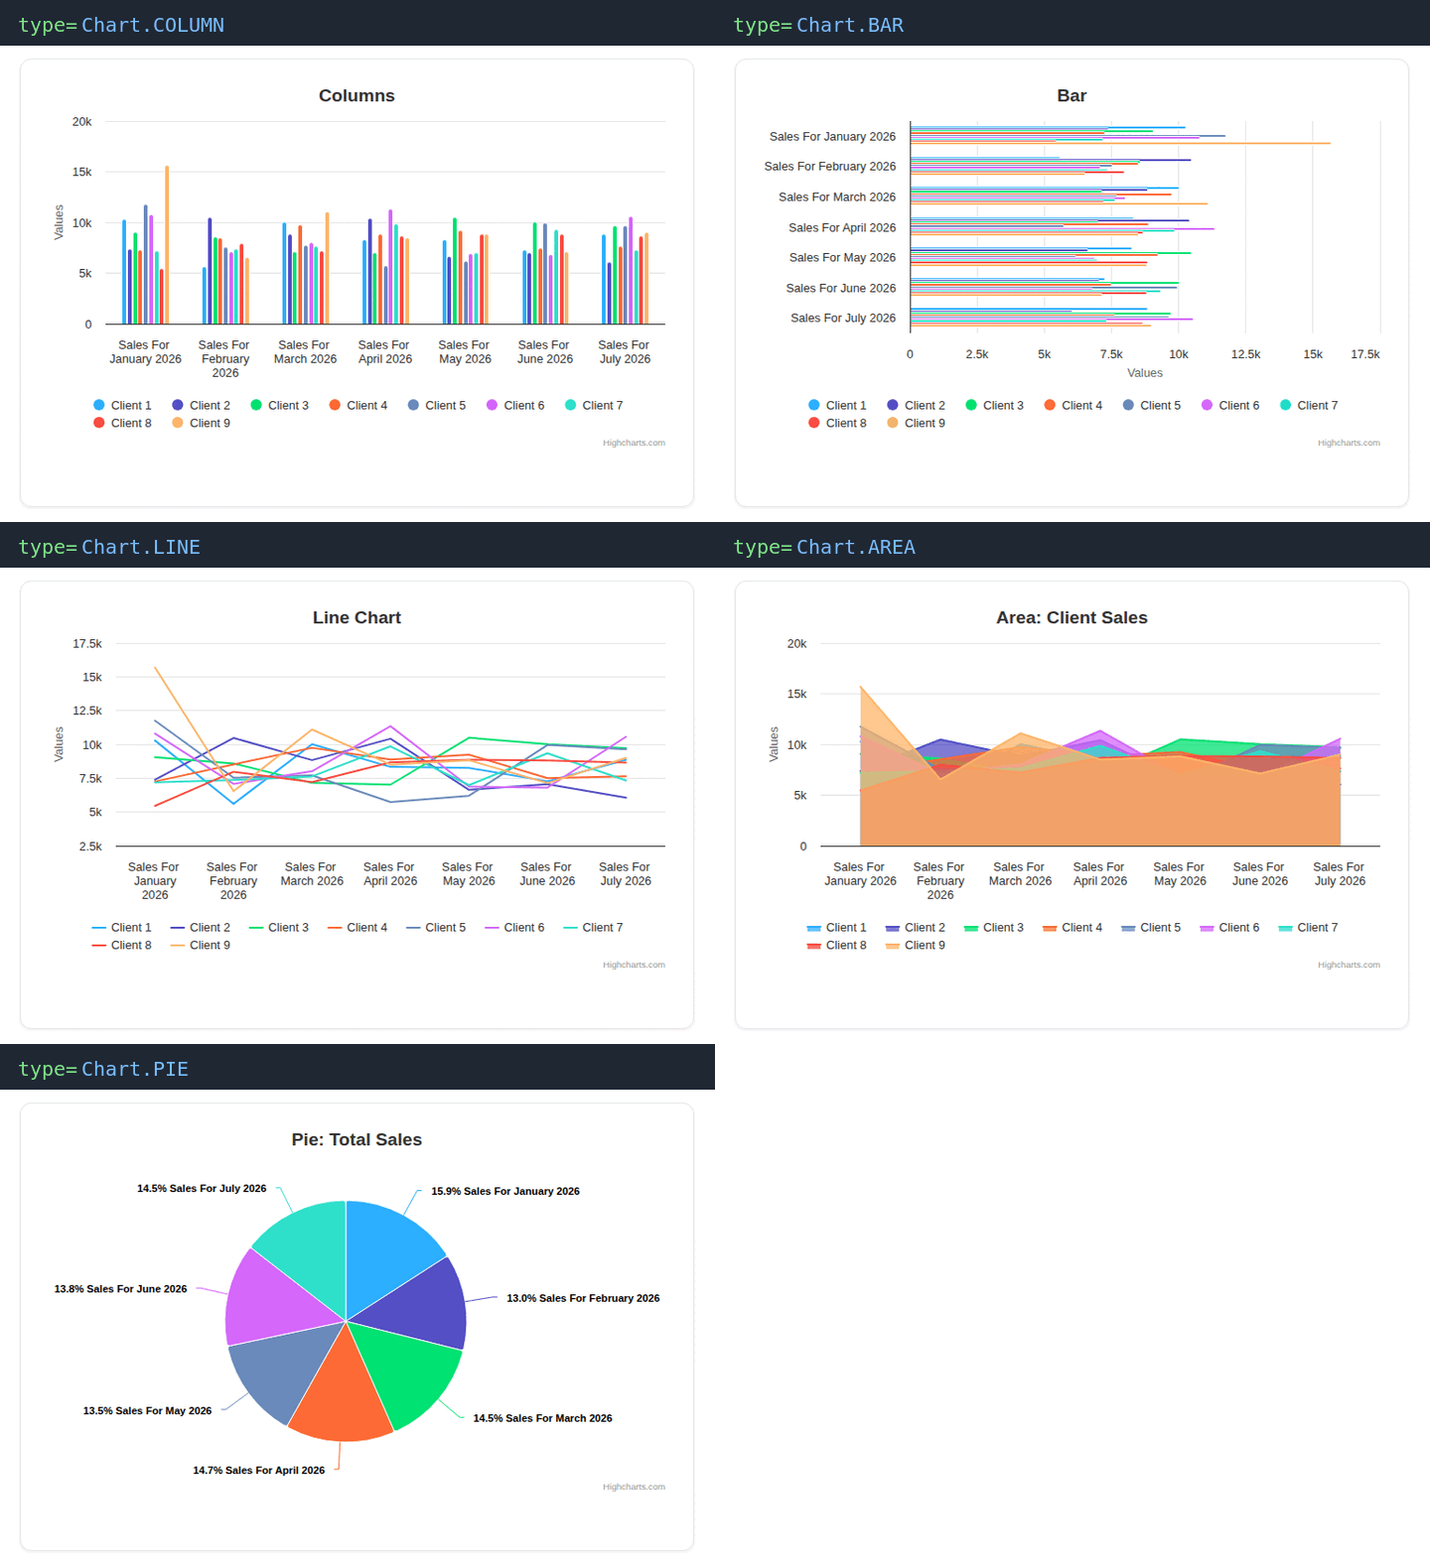
The chart is just configuration. Keep the report, change the Chart(...) line:
|
|
…and any chart engine
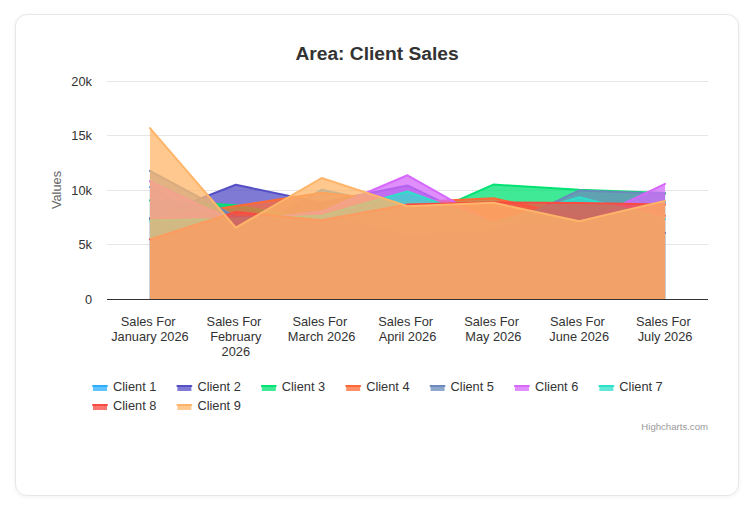
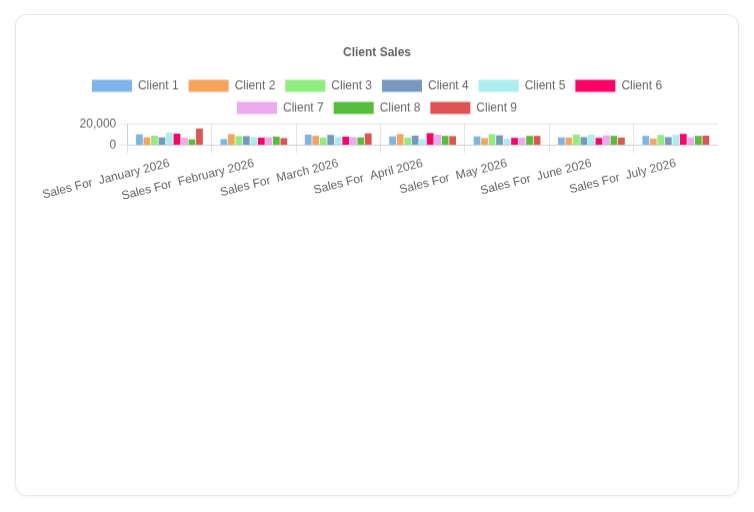
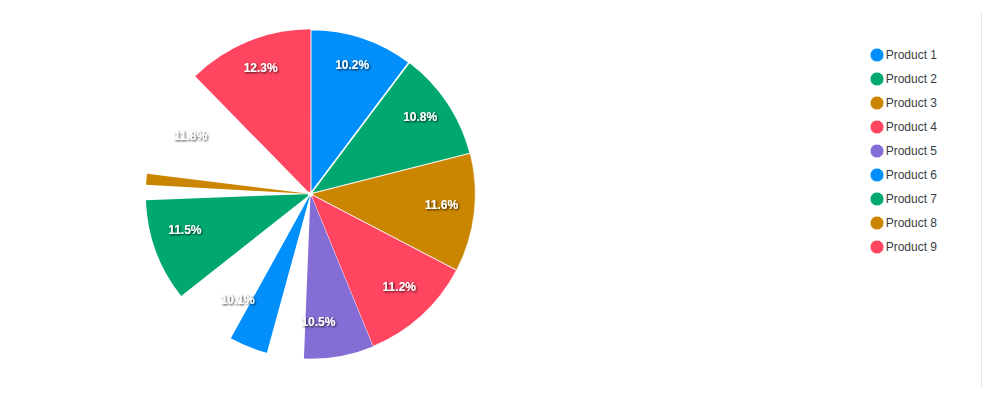
Set chart_engine on the report (or per Chart). The same data renders through your engine of choice:
Highchartschart_engine="highcharts" |
Chart.jschart_engine="chartsjs" |
ApexChartschart_engine="apexcharts" |
 |
 |
 |
Report types
Time series — one column per period (daily / weekly / monthly / yearly / custom)
class MonthlyProductSales(ReportView):
    report_model = SalesTransaction
    date_field = "date"
    group_by = "product"
    columns = ["name", "sku"]

    time_series_pattern = "monthly"          # daily / weekly / yearly / custom
    time_series_columns = [
        ComputationField.create(Sum, "value", name="value", verbose_name="Sales"),
    ]

    chart_settings = [
        Chart("Sales Monthly", Chart.COLUMN, data_source=["value"], title_source=["name"]),
    ]
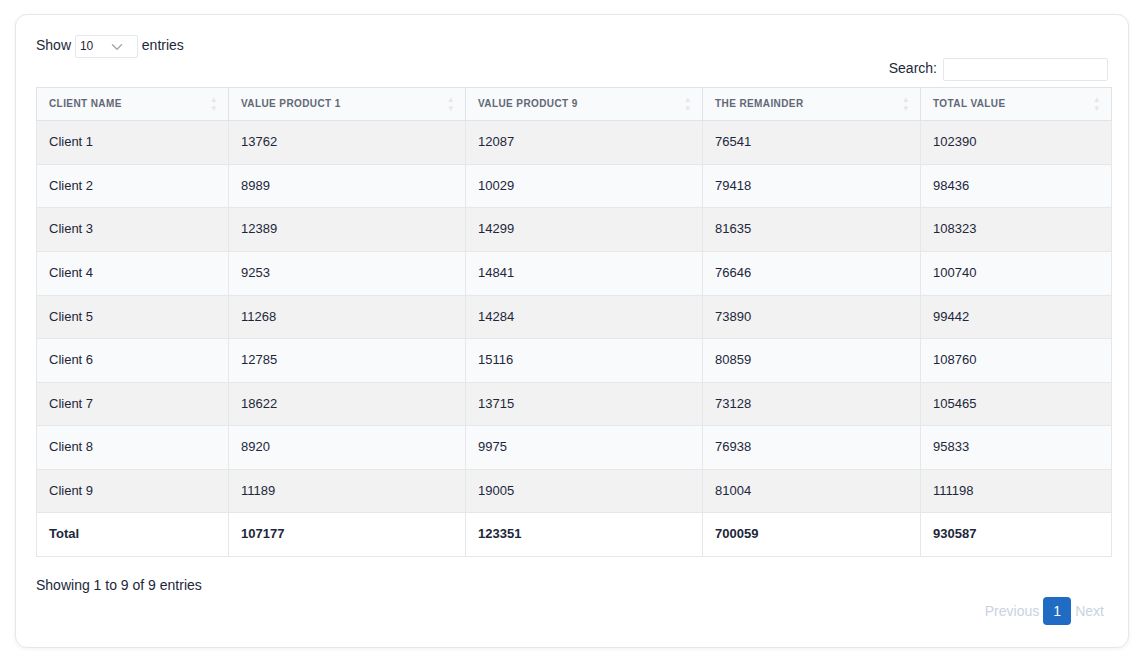
Crosstab / Pivot — matrix reports with rows, columns and intersecting totals
class ClientProductMatrix(ReportView):
    report_model = SalesTransaction
    group_by = "client"
    crosstab_field = "product"
    crosstab_columns = [
        ComputationField.create(Sum, "value", verbose_name="Value"),
    ]
    crosstab_compute_remainder = True         # a column capturing "everything else"

    columns = [
        "name",
        "__crosstab__",                       # where the matrix columns land
        ComputationField.create(Sum, "value", verbose_name="Total Value"),
    ]
List view — ungrouped, row-level data
from slick_reporting.views import ListReportView

class LastTenSales(ListReportView):
    report_model = SalesTransaction
    date_field = "date"
    columns = ["product__name", "client__name", "date", "quantity", "value"]
    default_order_by = "-date"
    limit_records = 10
Low-level engine — get raw data without a view
from slick_reporting.generator import ReportGenerator

report = ReportGenerator(
    report_model=SalesTransaction,
    group_by="product",
    columns=["title", "__total__"],
)
report.get_report_data()
# -> [{'title': 'Product 1', '__total__': 56}, {'title': 'Product 2', '__total__': 43}, ...]
Dashboards
Compose any report into a page as a self-contained widget — chart, table, or both — with one template tag:
{% load slick_reporting_tags %}

{% get_widget_from_url url_name="product-sales" %}
{% get_widget_from_url url_name="monthly-product-sales" chart_id=1 display_table=False title="Chart only" %}
See the live dashboard example.
Demo site
Live at django-slick-reporting.com, or run it locally:
git clone https://github.com/ra-systems/django-slick-reporting.git
python -m venv .venv && source .venv/bin/activate

cd django-slick-reporting/demo_proj
pip install -r requirements.txt
python manage.py migrate
python manage.py create_entries   # generates demo data
python manage.py runserver
Documentation
Full documentation lives on Read the Docs. Build it locally with:
cd docs
pip install -r requirements.txt
sphinx-build -b html source build
Running the tests
git clone [email protected]:ra-systems/django-slick-reporting.git
cd django-slick-reporting/tests
python -m pip install -e ..
python runtests.py
# coverage:
coverage run --include=../* runtests.py && coverage html
Contributing
PRs and reviews are most welcome. We follow Django's contributing guidelines. If the project is useful to you, please consider giving it a star — it keeps the project visible and motivated.
Authors
- Ramez Ashraf — Initial work — @RamezIssac
You might also like
- Django ERP Framework — build business solutions with ease.
- Django Tabular Permissions — Django permissions in a translatable, filterable HTML table.